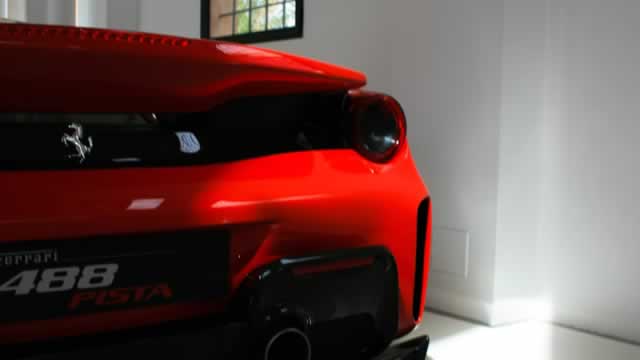
Sorry, haters. Ferrari's first EV is doing just fine
Sometimes the crowd isn't so wise.
TechCrunch7/29/2026Positive
Ferrari NV designs, designs, produces and sells high performance sports cars. The company is headquartered in Maranello, Italy.
| Revenue (TTM) | $7.20B |
| Gross Profit (TTM) | $3.72B |
| EBITDA | $2.42B |
| Operating Margin | 29.50% |
| Return on Equity | 42.00% |
| Return on Assets | 13.10% |
| Revenue/Share (TTM) | $40.53 |
| Book Value | $26.17 |
| Price-to-Book | 13.71 |
| Price-to-Sales (TTM) | 9.27 |
| EV/Revenue | 7.91 |
| EV/EBITDA | 27.10 |
| Quarterly Earnings Growth (YoY) | 1.30% |
| Quarterly Revenue Growth (YoY) | 3.20% |
| Shares Outstanding | $175.78M |
| Float | $174.14M |
| % Insiders | 30.49% |
| % Institutions | 43.04% |
Volatility is currently expanding
Sometimes the crowd isn't so wise.
Maranello (Italy), July 27, 2026 – Ferrari N.V. (NYSE/EXM: RACE) (“Ferrari” or the “Company”) informs that the Company has purchased, under the Euro 250 million share buyback program announced on April 10, 2026, as the second tranche of the multi-year share buyback program of approximately Euro 3.5 billion expected to be executed by 2030 in line with the disclosure made during the 2025 Capital Markets Day (the “Second Tranche”), the additional common shares - reported in aggregate form, on a daily basis - on the Euronext Milan (EXM) as follows:
Investors interested in Automotive - Original Equipment stocks are likely familiar with OPENLANE (OPLN) and Ferrari (RACE). But which of these two stocks offers value investors a better bang for their buck right now?
Maranello (Italy), July 15, 2026 - Ferrari N.V. (“Ferrari”) (NYSE/EXM: RACE) announced today that its financial results for the second quarter of 2026 will be released on Thursday, July 30, 2026.
Tesla is quickly transitioning from automaker to a technology and AI business. Ferrari has separated itself from mainstream auto companies through lucrative pricing power and lofty margins.
Maranello (Italy), July 13, 2026 – Ferrari N.V. (NYSE/EXM: RACE) (“Ferrari” or the “Company”) informs that the Company has purchased, under the Euro 250 million share buyback program announced on April 10, 2026, as the second tranche of the multi-year share buyback program of approximately Euro 3.5 billion expected to be executed by 2030 in line with the disclosure made during the 2025 Capital Markets Day (the “Second Tranche”), the additional common shares - reported in aggregate form, on a daily basis - on the Euronext Milan (EXM) as follows:
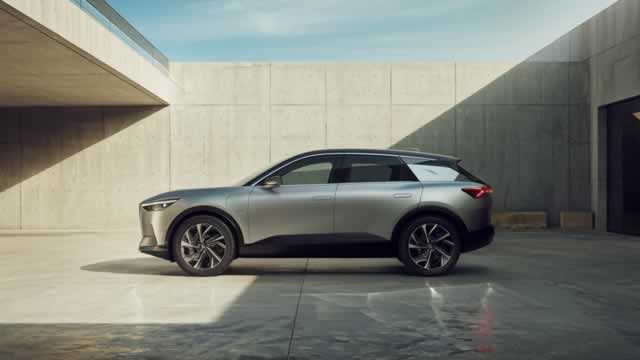
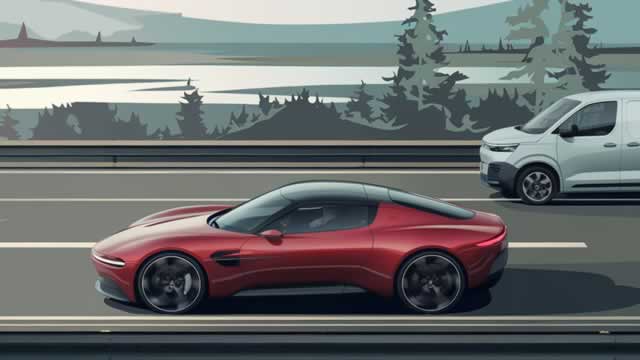
Baiju Bhatt, the Robinhood cofounder, said he's planning on buying the Ferrari Luce. He also said he plans on giving it to his wife.
Investors interested in stocks from the Automotive - Original Equipment sector have probably already heard of Lear (LEA) and Ferrari (RACE). But which of these two companies is the best option for those looking for undervalued stocks?
Maranello (Italy), July 6, 2026 – Ferrari N.V. (NYSE/EXM: RACE) (“Ferrari” or the “Company”) informs that the Company has purchased, under the Euro 250 million share buyback program announced on April 10, 2026, as the second tranche of the multi-year share buyback program of approximately Euro 3.5 billion expected to be executed by 2030 in line with the disclosure made during the 2025 Capital Markets Day (the “Second Tranche”), the additional common shares - reported in aggregate form, on a daily basis - on the New York Stock Exchange (NYSE) as follows:
Ferrari launched a limited-edition 12-cylinder model with a manual gearbox on Friday, appealing to traditional fans of roaring petrol engines and hands-on driving after the mixed initial reception for its first electric vehicle.
Tiblio connects your broker and runs your put-and-call-writing strategy for you — on RACE and any ticker you trade — then tracks every position and per-strategy win rate.