


Here's Why HP (HPQ) is a Strong Value Stock
Wondering how to pick strong, market-beating stocks for your investment portfolio? Look no further than the Zacks Style Scores.
Zacks Investment Research10/16/2026Positive
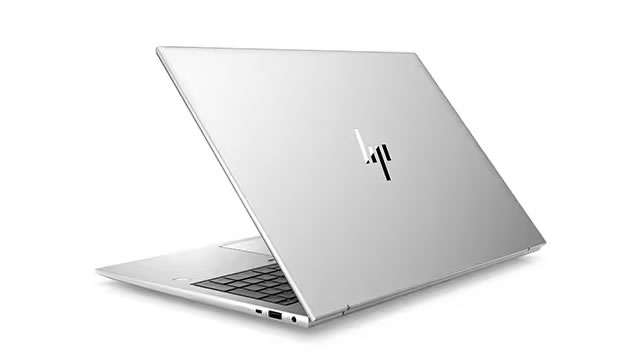
HP Inc. is an American multinational information technology company headquartered in Palo Alto, California, that develops personal computers (PCs), printers and related supplies, as well as 3D printing solutions.
| Revenue (TTM) | $59.16B |
| Gross Profit (TTM) | $11.63B |
| EBITDA | $4.64B |
| Operating Margin | 5.40% |
| Return on Equity | 0.00% |
| Return on Assets | 5.63% |
| Revenue/Share (TTM) | $63.85 |
| Book Value | $-0.10 |
| Price-to-Book | 0.61 |
| Price-to-Sales (TTM) | 0.46 |
| EV/Revenue | 0.593 |
| EV/EBITDA | 8.34 |
| Quarterly Earnings Growth (YoY) | -11.30% |
| Quarterly Revenue Growth (YoY) | 12.50% |
| Shares Outstanding | $901.79M |
| Float | $898.94M |
| % Insiders | 0.30% |
| % Institutions | 96.11% |
Volatility is currently contracting
Wondering how to pick strong, market-beating stocks for your investment portfolio? Look no further than the Zacks Style Scores.

HP (HPQ) reached $30.85 at the closing of the latest trading day, reflecting a +1.28% change compared to its last close.

HP is advancing AI PCs, premium computing and printing innovations as rising average selling prices and a discounted valuation support its growth outlook.

On October 7, three companies with nothing in common sent cash to their shareholders, but the differences in what each paid, how fast each raised it, and what the stock price does to the math tell three very different income

HP (HPQ) closed the most recent trading day at $32.24, moving +1.61% from the previous trading session.

HP expands its local AI portfolio with NVIDIA RTX Spark Windows PCs, Perplexity experiences, and the first Windows demo on the GB300-powered HP ZGX Fury.
In the latest trading session, HP (HPQ) closed at $32.15, marking a +2.78% move from the previous day.

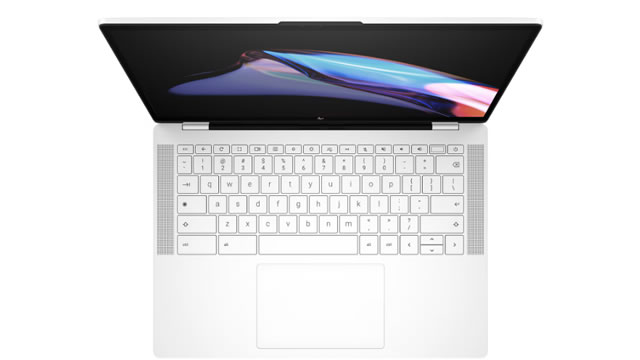
News Highlights: HP OmniBook 5 combines vibrant OLED visuals, rich audio, and AI-enhanced capabilities to help consumers create, connect and be entertained wherever they go HP ProBook 4 equips growing businesses with AI-ready performance and portability to stay productive wherever work happens PALO ALTO, Calif., Oct. 01, 2026 (GLOBE NEWSWIRE) -- Today, HP Inc. (NYSE: HPQ) announced the new HP OmniBook 5, a premium consumer Windows laptop designed for people who want more from their everyday device: more screen, more battery life, more connectivity and more freedom to create, connect and be entertained without compromise.

The latest trading day saw HP (HPQ) settling at $31.28, representing a +1.79% change from its previous close.
HP (HPQ) reported earnings 30 days ago. What's next for the stock?
Tiblio connects your broker and runs your put-and-call-writing strategy for you — on HPQ and any ticker you trade — then tracks every position and per-strategy win rate.