


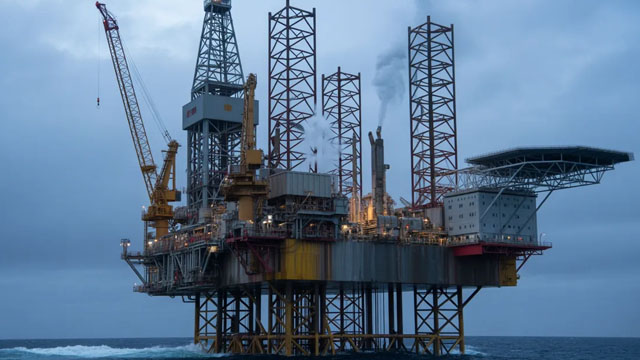
5 Low-Leverage Stocks to Buy as US Treasury Yields Cool Down
These five low-leverage stocks stand out for manageable debt, solid earnings growth and financial resilience as Treasury yields cool.
Zacks Investment Research9/28/2026Positive
Green Plains Inc. produces, markets, and distributes ethanol in the United States and internationally. The company is headquartered in Omaha, Nebraska.
| Revenue (TTM) | $1.83B |
| Gross Profit (TTM) | $293.43M |
| EBITDA | $204.08M |
| Operating Margin | 15.20% |
| Return on Equity | 15.50% |
| Return on Assets | 4.15% |
| Revenue/Share (TTM) | $26.38 |
| Book Value | $12.41 |
| Price-to-Book | 1.22 |
| Price-to-Sales (TTM) | 0.55 |
| EV/Revenue | 0.768 |
| EV/EBITDA | 5.94 |
| Quarterly Earnings Growth (YoY) | -75.50% |
| Quarterly Revenue Growth (YoY) | -19.30% |
| Shares Outstanding | $70.09M |
| Float | $68.92M |
| % Insiders | 1.84% |
| % Institutions | 118.14% |
Volatility is currently expanding
These five low-leverage stocks stand out for manageable debt, solid earnings growth and financial resilience as Treasury yields cool.
Low price-to-sales stocks can signal value, when supported by solid fundamentals, improving margins and healthy financial strength. PRAA, TPC, DINO, GPRE and PBF stand out.

ALTO and GPRE are pursuing different biofuel strategies as ethanol producers navigate corn prices, policy shifts and low-carbon demand.

Green Plains is rated Buy, supported by surging margins from favorable feedstock-product spreads and critical Section 45Z tax credits. GPRE's gross margin per corn bushel rose 274% YoY, driven by $1.11/bushel in tax credits and higher average sales prices. Legislative support, including EPA mandates and extended tax credits through 2029, underpins sustained demand for corn ethanol and value-added biofuels.

ARDX, ARDT and GPRE have been added to the Zacks Rank #5 (Strong Sell) List on August 7th, 2026.

Green Plains NASDAQ: GPRE reported second-quarter adjusted EBITDA of $93.3 million, up from $71.5 million in the first quarter and $16.4 million in the prior-year period, as its carbon platform expanded and operating conditions for ethanol and co-products remained favorable.

Green Plains Inc. (GPRE) Q2 2026 Earnings Call Transcript

Green Plains Renewable Energy (GPRE) came out with quarterly earnings of $0.83 per share, beating the Zacks Consensus Estimate of $0.65 per share. This compares to a loss of $0.41 per share a year ago.

Green Plains (GPRE) doesn't possess the right combination of the two key ingredients for a likely earnings beat in its upcoming report. Get prepared with the key expectations.

OMAHA, Neb.--(BUSINESS WIRE)--Green Plains Inc. (NASDAQ:GPRE) will release second quarter 2026 financial results prior to the market opening on August 6, 2026, and then host a conference call beginning at 9 a.m. Eastern time (8 a.m. Central time) to discuss the results and outlook. Domestic and international participants can access the conference call by dialing 833.461.5787 and 585.542.9983, respectively, and referencing conference ID 249495185. Participants are advised to call at least 10 min.
Tiblio connects your broker and runs your put-and-call-writing strategy for you — on GPRE and any ticker you trade — then tracks every position and per-strategy win rate.