


Why Is Grocery Outlet (GO) Up 2.6% Since Last Earnings Report?
Grocery Outlet (GO) reported earnings 30 days ago. What's next for the stock?
Zacks Investment Research9/11/2026Positive
Grocery Outlet Holding Corp. The company is headquartered in Emeryville, California.
| Revenue (TTM) | $4.74B |
| Gross Profit (TTM) | $1.42B |
| EBITDA | $203.11M |
| Operating Margin | 1.78% |
| Return on Equity | -38.10% |
| Return on Assets | 1.40% |
| Revenue/Share (TTM) | $48.17 |
| Book Value | $8.24 |
| Price-to-Book | 1.35 |
| Price-to-Sales (TTM) | 0.27 |
| EV/Revenue | 0.608 |
| EV/EBITDA | 20.06 |
| Quarterly Earnings Growth (YoY) | 13.60% |
| Quarterly Revenue Growth (YoY) | 1.10% |
| Shares Outstanding | $99.08M |
| Float | $87.82M |
| % Insiders | 6.12% |
| % Institutions | 122.15% |
Volatility is currently contracting
Grocery Outlet (GO) reported earnings 30 days ago. What's next for the stock?
The value of the purchase was approximately $176,000. The traded shares equal 16% of the total equity stake held by the insider prior to the filing.
Grocery Outlet Bargain Market offers deep value through opportunistic buying, but fundamentals are currently unappetizing. GO's comp sales are in decline, margins have compressed since 2019, and TTM net income margins remain negative despite a recent return to profitability. Rapid expansion, supply chain disruptions, and a botched ERP rollout have hampered GO's turnaround efforts and pressured its unique business model.
Investors need to pay close attention to GO stock based on the movements in the options market lately.
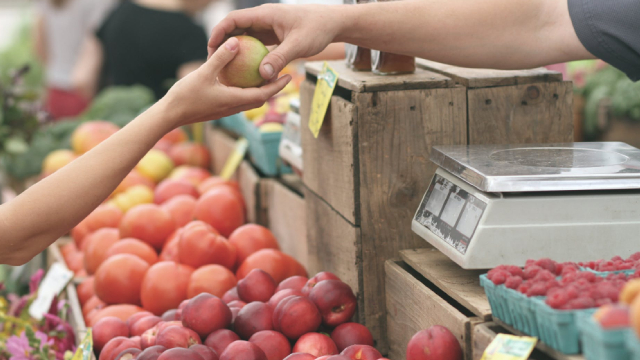
The insider acquired 8,000 shares on August 20, 2026, for a total transaction value of $87,200. The purchase increased the insider's direct equity holdings by 12%.
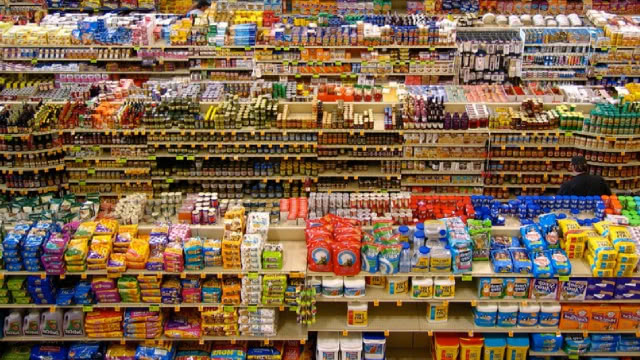
A major grocery store has closed down eight locations in California.
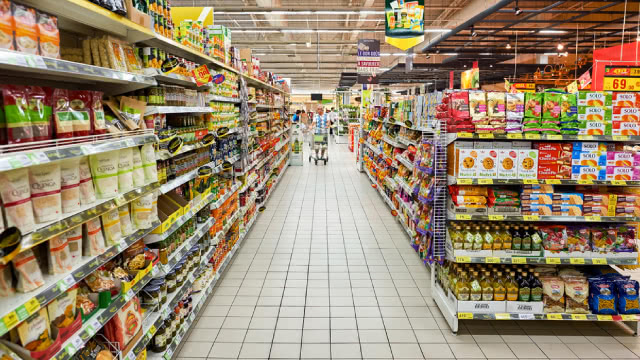
Back in March, discount grocery chain Grocery Outlet Bargain Market announced plans to close 36 underperforming locations. The store closures are part of a broader restructuring aimed at strengthening its long-term profitability and optimizing its existing store footprint.

EMERYVILLE, Calif., Aug. 17, 2026 (GLOBE NEWSWIRE) -- Grocery Outlet Holding Corp. (NASDAQ: GO) ("Grocery Outlet" or the "Company") today announced the completion of its 16th annual Independence from Hunger® Food Drive, which successfully raised over $4 million to support local food banks.
Grocery Outlet beats Q2 estimates and raises key 2026 targets as comparable-store sales and basket trends improve sequentially.
Grocery Outlet Holding Corp. (GO) Q2 2026 Earnings Call Transcript
Tiblio connects your broker and runs your put-and-call-writing strategy for you — on GO and any ticker you trade — then tracks every position and per-strategy win rate.