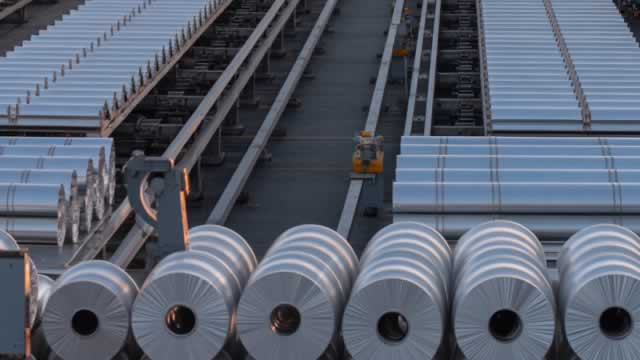
CENX

Century Aluminum Company
NASDAQBASIC MATERIALSALUMINUM

Key Statistics

Market Cap
$6.06B
P/E Ratio
18.21
EPS
$3.36
Beta
1.92
52W High
$70.43
52W Low
$16.59
50-Day MA
$62.52
200-Day MA
$44.23
Dividend Yield
Profit Margin
13.70%
Forward P/E
6.48
PEG Ratio
0.06

About Century Aluminum Company

Century Aluminum Company produces standard quality and value-added primary aluminum products in the United States and Iceland. The company is headquartered in Chicago, Illinois.

Official WebsiteUSAFY End: December

Fundamentals

Revenue (TTM)$2.54B
Gross Profit (TTM)$309.50M
EBITDA$291.90M
Operating Margin13.30%
Return on Equity32.30%
Return on Assets5.46%
Revenue/Share (TTM)$26.60
Book Value$11.63
Price-to-Book5.24
Price-to-Sales (TTM)2.38
EV/Revenue2.49
EV/EBITDA14.25
Quarterly Earnings Growth (YoY)1010.00%
Quarterly Revenue Growth (YoY)2.40%
Shares Outstanding$98.97M
Float$68.61M
% Insiders30.90%
% Institutions74.59%

Historical Volatility

HV 10-Day
79.62%
HV 20-Day
75.41%
HV 30-Day
67.24%
HV 60-Day
68.67%
HV Rank
52.4%

Volatility is currently expanding

Analyst Ratings

Consensus ($81.33 target)
3
Buy

More BASIC MATERIALS Stocks

Data last updated: 6/13/2026