

Eni Begins Maha Gas Production, Boosting Indonesia's Offshore Output
E starts gas production at Indonesia's Maha field, adding 250 MMSCFD of capacity and strengthening its Southeast Asian growth prospects.
Zacks Investment Research11/2/2026Positive
Eni SpA is dedicated to the exploration, development and production of crude oil and natural gas. The company is headquartered in Rome, Italy.
| Revenue (TTM) | $97.28B |
| Gross Profit (TTM) | $21.34B |
| EBITDA | $14.66B |
| Operating Margin | 8.58% |
| Return on Equity | 13.10% |
| Return on Assets | 3.56% |
| Revenue/Share (TTM) | $66.28 |
| Book Value | $42.43 |
| Price-to-Book | 1.32 |
| Price-to-Sales (TTM) | 0.81 |
| EV/Revenue | 0.938 |
| EV/EBITDA | 3.74 |
| Quarterly Earnings Growth (YoY) | 343.80% |
| Quarterly Revenue Growth (YoY) | 26.70% |
| Shares Outstanding | $1.42B |
| Float | $863.29M |
| % Insiders | 0.00% |
| % Institutions | 1.83% |
Volatility is currently expanding
E starts gas production at Indonesia's Maha field, adding 250 MMSCFD of capacity and strengthening its Southeast Asian growth prospects.

BP, ExxonMobil, ConocoPhillips & Eni emerge as low-beta stock picks amid market volatility, supported by oil prices, upstream growth prospects and investments.
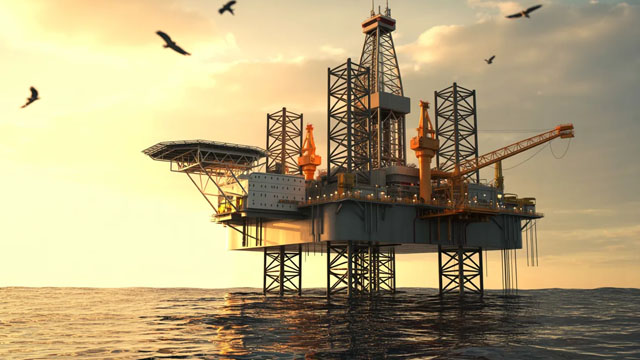
Cyprus' Cronos gas project enters execution, bringing E and TTE closer to LNG production, while CVX's Aphrodite project advances toward development.
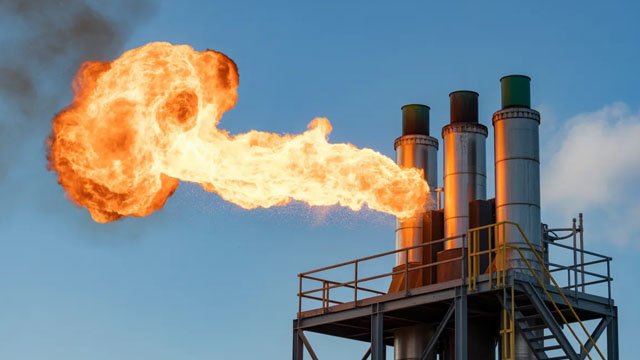
E starts up Egypt's Meleiha Phase 2 project, adding gas processing capacity of 100 million cubic feet per day to support production growth.
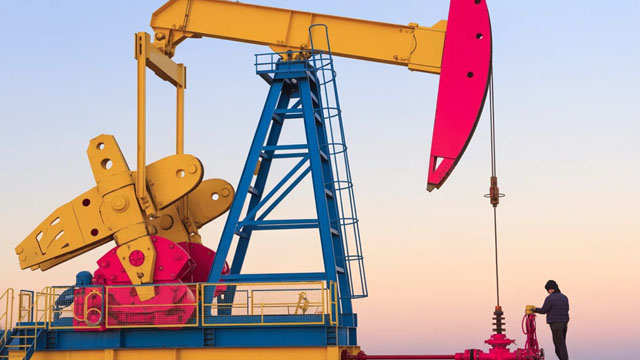
Eni raises its 2026 cash flow outlook, boosts shareholder payouts to euro 8.2B and targets upstream growth while maintaining disciplined capital spending.
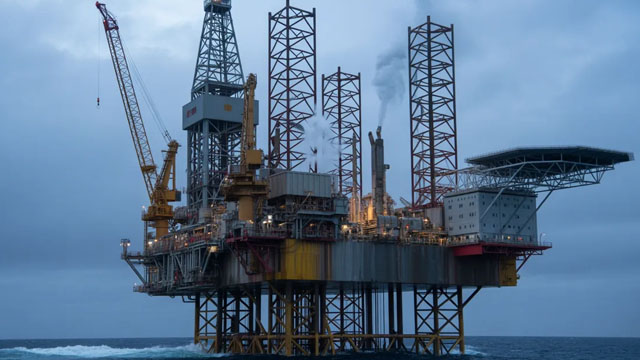
Eni raised its 2026 cash-flow forecast to 16.5 billion euros. Eni increased its 2026 share buyback target to 3.8 billion euros.
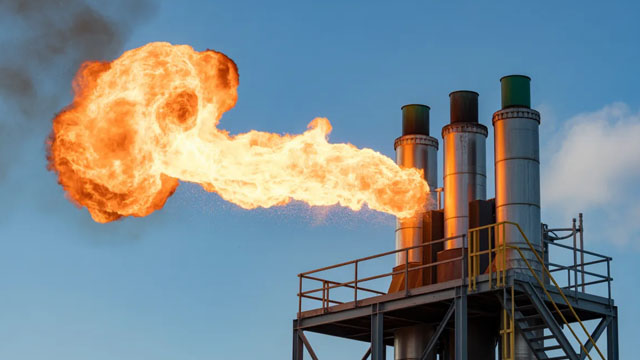
Eni to sign up to $1.8 billion of infrastructure contracts for Cyprus gas project soon, WSJ reports
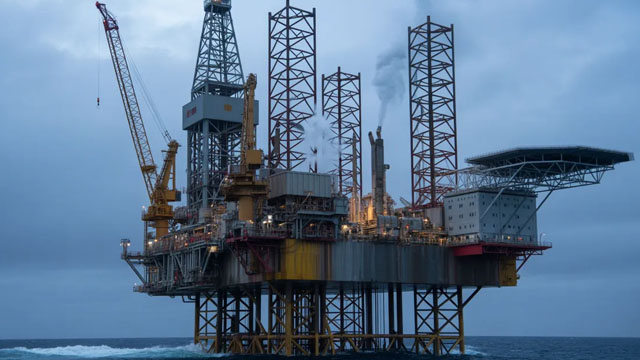
Eni advances Venezuelan heavy oil project, eyes year-end approval
The contracts involve building subsea infrastructure that will help extract, treat and send gas to Egypt via underwater pipelines, according to people familiar with the matter.
ENI NYSE: E reported higher third-quarter earnings and cash flow, lifted full-year production and cash flow guidance, and increased shareholder distributions as upstream growth, gas optimization and strong biofuel margins supported results.
Tiblio connects your broker and runs your put-and-call-writing strategy for you — on E and any ticker you trade — then tracks every position and per-strategy win rate.