


BP (BP) is a Top-Ranked Value Stock: Should You Buy?
Wondering how to pick strong, market-beating stocks for your investment portfolio? Look no further than the Zacks Style Scores.
Zacks Investment Research10/16/2026Positive
BP plc participates in the energy business globally. The company is headquartered in London, the United Kingdom.
| Revenue (TTM) | $215.47B |
| Gross Profit (TTM) | $60.98B |
| EBITDA | $39.20B |
| Operating Margin | 13.20% |
| Return on Equity | 8.87% |
| Return on Assets | 5.04% |
| Revenue/Share (TTM) | $20.88 |
| Book Value | $5.65 |
| Price-to-Book | 1.90 |
| Price-to-Sales (TTM) | 0.60 |
| EV/Revenue | 0.679 |
| EV/EBITDA | 3.71 |
| Quarterly Earnings Growth (YoY) | 138.90% |
| Quarterly Revenue Growth (YoY) | 48.20% |
| Shares Outstanding | $2.58B |
| Float | $10.05B |
| % Insiders | 0.00% |
| % Institutions | 14.09% |
Volatility is currently expanding
Wondering how to pick strong, market-beating stocks for your investment portfolio? Look no further than the Zacks Style Scores.

Rising inflation and rate uncertainty put income stocks in focus. Discover four high-yield dividend stocks offering yields up to 6.22% and growth prospects.
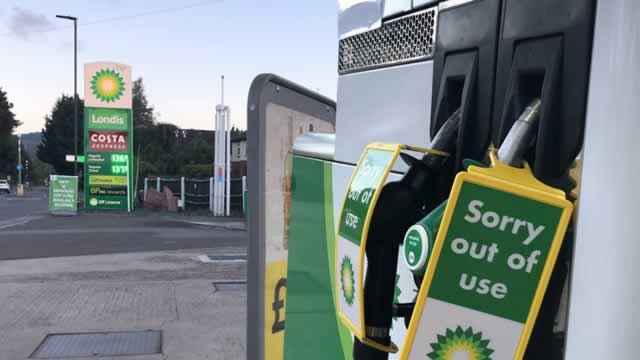
Here is how BP (BP) and HighPeak Energy, Inc. (HPK) have performed compared to their sector so far this year.

BP delivered rapid deleveraging, aided by war-driven crude price spikes, but the upside is now capped at current valuations. Q3 refining margins surged to $46.7/bbl, boosting results, yet BP's leverage to refining is structurally reduced after asset sales. Net debt is set to fall dramatically to $13.5–$14.5B, with further proceeds from Castrol expected before year-end.

BP expects net debt to decline sharply in the third quarter of 2026 as stronger refining margins and gas trading support earnings despite lower oil prices.

BP PLC's (LSE:BP.) net debt is on course to come in as much as $4 billion below previous estimates, according to UBS, which has a 'buy' rating and a 700p price target on the oil major.
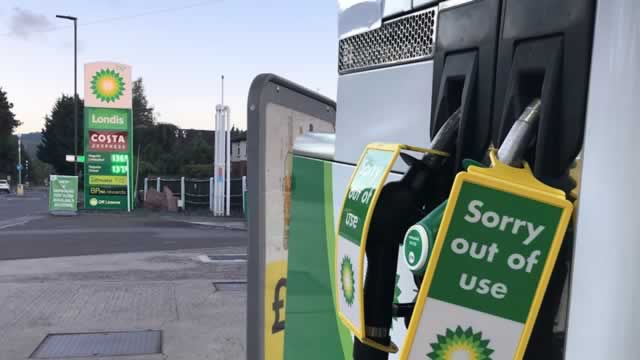
BP (BP) is at a 52-week high, but can investors hope for more gains in the future? We take a look at the company's fundamentals for clues.

The Zacks Earnings ESP is a great way to find potential earnings surprises. Why investors should take advantage now.

BP, PBF, VLO and MPC emerge as low-beta energy stock picks to navigate market volatility fueled by high oil prices and Middle East tensions.

CVX and SHEL are leading the U.S. Gulf oil production recovery after Hurricane Isaias, restoring offshore operations as facilities report no storm damage.
Tiblio connects your broker and runs your put-and-call-writing strategy for you — on BP and any ticker you trade — then tracks every position and per-strategy win rate.