WMB

Williams Companies Inc
NYSEENERGYOIL & GAS MIDSTREAM

Key Statistics

Market Cap
$87.19B
P/E Ratio
27.63
EPS
$2.58
Beta
0.66
52W High
$78.92
52W Low
$54.53
50-Day MA
$72.29
200-Day MA
$71.76
Dividend Yield
2.96%
Profit Margin
24.90%
Forward P/E
26.81
PEG Ratio
2.08

About Williams Companies Inc

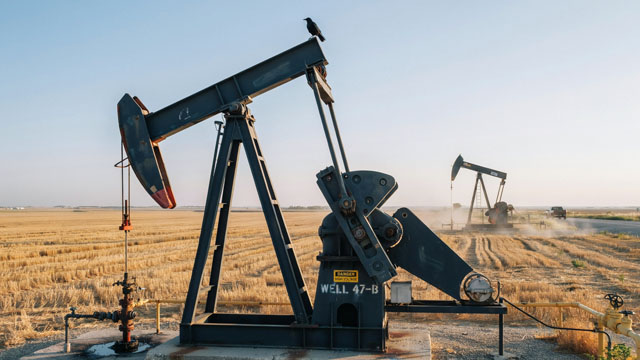
The Williams Companies, Inc., is an American energy company based in Tulsa, Oklahoma. Its core business is natural gas processing and transportation, with additional petroleum and electricity generation assets.

Official WebsiteUSAFY End: December

Fundamentals

Revenue (TTM)$12.32B
Gross Profit (TTM)$7.84B
EBITDA$7.03B
Operating Margin39.50%
Return on Equity21.50%
Return on Assets5.03%
Revenue/Share (TTM)$10.08
Book Value$10.76
Price-to-Book6.77
Price-to-Sales (TTM)7.08
EV/Revenue9.81
EV/EBITDA14.85
Quarterly Earnings Growth (YoY)51.20%
Quarterly Revenue Growth (YoY)7.80%
Shares Outstanding$1.22B
Float$1.22B
% Insiders0.45%
% Institutions91.64%

Historical Volatility

HV 10-Day
38.36%
HV 20-Day
29.63%
HV 30-Day
27.47%
HV 60-Day
28.49%
HV Rank
77.0%

Volatility is currently expanding

Analyst Ratings

Consensus ($85.38 target)
5
Strong Buy
17
Buy
2
Hold

Latest News

NTHM's Index Rebalance Puts Thematic Rotation to Work

The latest rebalance of VettaFi's Thematic Rotation Quality Momentum Screened Index (TQRMS), tracked by the NBI Thematic Rotation ETF (NTHM:TSX), reshapes the portfolio around a new set of themes. GLP-1 weight loss drug manufacturers and midstream energy join the index, while battery technology & storage and software-as-a-service (SaaS) exit.

ETF Trends9/25/2026Neutral

Turn research into an automated options-selling system

Tiblio connects your broker and runs your put-and-call-writing strategy for you — on WMB and any ticker you trade — then tracks every position and per-strategy win rate.

See how it works

More ENERGY Stocks

Data last updated: 10/17/2026