BLMN

Bloomin Brands Inc
NASDAQCONSUMER CYCLICALRESTAURANTS

Key Statistics

Market Cap
$665.22M
P/E Ratio
33.78
EPS
$0.23
Beta
1.20
52W High
$10.48
52W Low
$5.19
50-Day MA
$7.76
200-Day MA
$6.93
Dividend Yield
3.76%
Profit Margin
0.55%
Forward P/E
6.25
PEG Ratio
1.07

About Bloomin Brands Inc

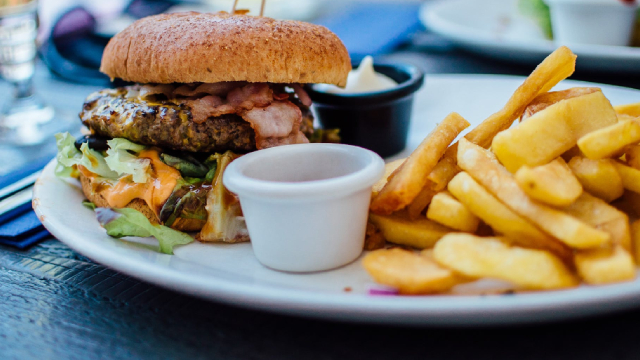
Bloomin 'Brands, Inc. owns and operates casual, upscale casual and fine dining restaurants in the United States and internationally. The company is headquartered in Tampa, Florida.

Official WebsiteUSAFY End: December

Fundamentals

Revenue (TTM)$3.97B
Gross Profit (TTM)$533.57M
EBITDA$304.24M
Operating Margin6.42%
Return on Equity6.82%
Return on Assets2.48%
Revenue/Share (TTM)$46.57
Book Value$4.63
Price-to-Book1.88
Price-to-Sales (TTM)0.17
EV/Revenue0.667
EV/EBITDA12.08
Quarterly Earnings Growth (YoY)29.90%
Quarterly Revenue Growth (YoY)1.00%
Shares Outstanding$85.61M
Float$83.20M
% Insiders1.35%
% Institutions92.34%

Historical Volatility

HV 10-Day
55.56%
HV 20-Day
64.42%
HV 30-Day
60.80%
HV 60-Day
89.22%
HV Rank
39.7%

Volatility is currently contracting

Analyst Ratings

Consensus ($8.61 target)
2
Buy
9
Hold
2
Strong Sell

Latest News

3 Dividend Stocks With Insiders Buying in 2026

Dividends are a driving force of the investment world, providing investors with access to company profits and a reliable income stream. Add in the signals provided by insider buying, and the stage is set for market-beating total returns over time.

MarketBeat5/19/2026Positive
Bloomin' Brands: Stock Explodes Higher, But Performance Still Lags

Bloomin' Brands (BLMN) delivered a better-than-expected Q1, with a 40% stock rally driven by positive comps and EPS growth. Q1 revenues rose 1.0% to $1.06B, with positive comps in all brands except Outback; Bonefish Grill led at 6.1%. Margins remained largely stable year-over-year, with adjusted EPS at $0.67, a $0.10 beat, aided by restructuring adjustments.

Seeking Alpha5/7/2026Neutral

More CONSUMER CYCLICAL Stocks

Data last updated: 7/9/2026