Positions
Positions Overview
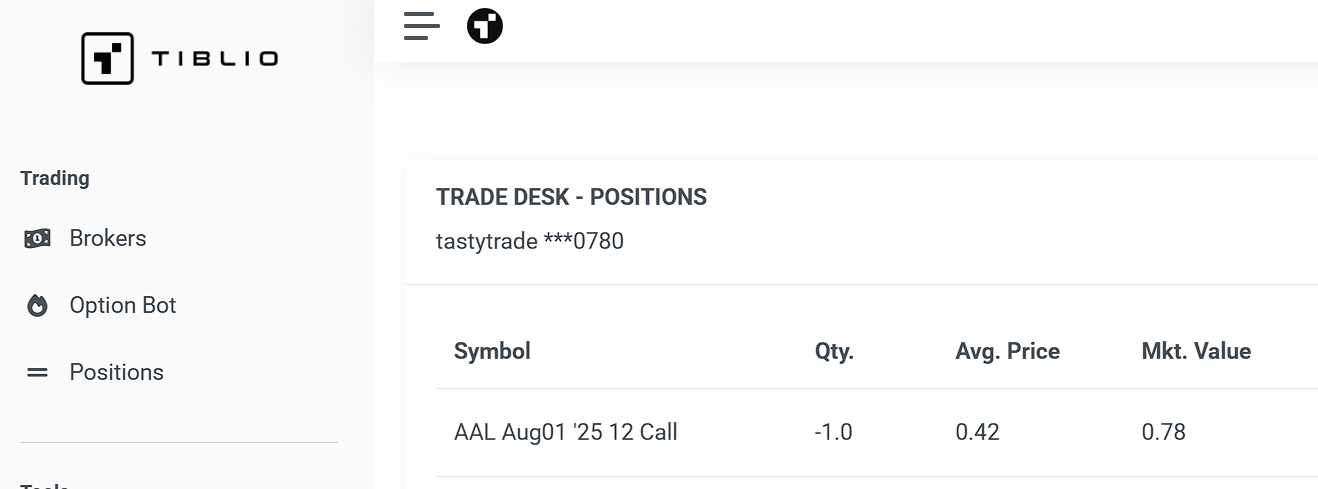
The Positions page serves as your comprehensive portfolio monitoring center, providing real-time visibility into all your active trading positions across connected brokerage accounts. This essential tool displays detailed position information and profit and loss metrics, helping you make informed decisions about your portfolio management and risk assessment.
Accessing Your Positions
The Positions page is available to users with connected brokerage accounts through Tiblio's Trade Desk integration. Access your positions by navigating to the Trading section in the main menu and selecting "Positions". The page requires an active broker connection and will prompt you to connect a supported broker if no account is linked.
Supported Brokers
Positions data is available for all supported brokers including:
- Charles Schwab
- tastytrade
- TradeStation
- Tradier Brokerage
Color-Coded Performance
Profit and loss figures use intuitive color coding:
- Green text indicates positive performance (profits)
- Red text indicates negative performance (losses)
Position Data Columns
- Sym (Symbol) - The ticker symbol for stocks or formatted option symbol for options contracts
- Mark - Current market price of the position
- Chg (Change) - Price change from the previous close to current market price
- Pos (Position) - Number of shares, contracts, or spreads you currently hold
- Cost - The original cost basis (debit paid or credit received) when opening the position
- P&L - Current profit or loss amount and percentage for the position
Position Types
The system displays various position types including:
- Stock shares
- Individual options contracts (puts and calls)
- Both long and short positions
Interactive Position Management
Position Actions
Each position includes management options for direct trading actions:
- Close Position - Quickly close individual positions with pre-populated order forms
Understanding Key Metrics
Daily P&L Calculation
Daily P&L represents the change in your portfolio value from the previous market close to the current moment. This includes:
- Price movements in stock positions
- Options value changes due to price, time decay, and volatility
- Impact of any trades executed during the current session
Net Liquidating Value (NLV)
NLV provides a realistic assessment of your account's current liquidation value by combining:
- Cash balances
- Market value of long positions (at bid price)
- Market value of short positions (at ask price)
Position-Level P&L
Individual position P&L calculations account for:
- Current market price versus cost basis
- For options: time decay, implied volatility changes, and underlying price movement
- For spreads: net value of all legs combined
Position Monitoring Strategies
Risk Management
Use the positions page to:
- Monitor positions approaching profit targets or stop losses
- Identify positions with excessive concentration risk
- Track correlation between related positions
- Assess overall portfolio balance and exposure
Options-Specific Monitoring
For options traders, pay attention to:
- Time decay impact on short options positions
- Delta exposure and directional risk
- Approaching expiration dates requiring action
- Assignment risk on in-the-money short options
Advanced Features
Account Switching
Users with multiple connected accounts can easily switch between accounts to view different position sets and account balances.
Data Refresh
Position data does not refresh automatically with the page open. Refresh the page in your browser to load new information.
The Positions page serves as your central command center for portfolio oversight, providing the real-time information necessary for effective position management and risk control across all your trading activities.