Options Screener Guide - Cash Secured Puts, Covered Calls & Vertical Spreads
Options strategies let investors generate income and manage risk. Three popular strategies include cash secured puts, covered calls, and vertical spreads. Each strategy serves different market conditions and risk profiles.
Cash Secured Puts
What Are Cash Secured Puts?
A cash secured put requires you to sell a put option. You collect money upfront. If the stock price stays above your strike price, you keep the money. If the stock price falls below your strike price, you buy the stock at the strike price.
You need enough cash in your account to buy 100 shares of the stock at the strike price. This cash serves as collateral for the put option you sold.
Why Sell Cash Secured Puts?
Investors sell cash secured puts for three main reasons:
- Income Generation: Collect money from selling put options while waiting for stock opportunities
- Stock Acquisition: Buy stocks at lower prices than current market value
- Risk Management: Set purchase prices in advance and get paid to wait
Covered Calls
What Are Covered Calls?
A covered call requires you to own 100 shares of stock and sell a call option against those shares. You collect money upfront from selling the call. If the stock price stays below your strike price, you keep the premium and your shares. If the stock price rises above your strike price, you sell your shares at the strike price.
The shares you own serve as collateral for the call option you sold. This limits your risk compared to selling naked calls.
Why Sell Covered Calls?
Investors sell covered calls for three main reasons:
- Income Enhancement: Generate income from stocks you already own
- Stock Exit Strategy: Sell shares at predetermined prices while collecting premium
- Portfolio Protection: Reduce cost basis of holdings through premium collection
Vertical Spreads
What Are Vertical Spreads?
A vertical spread involves selling one option and buying another option of the same type with different strike prices. Both options have the same expiration date. You collect the difference between the two option prices as premium.
For example, you might sell a $100 put and buy a $95 put. You collect the net premium but limit your risk to the difference between strikes minus the premium collected.
Why Trade Vertical Spreads?
Investors trade vertical spreads for three main reasons:
- Defined Risk: Maximum loss is limited to the spread width minus premium collected
- Capital Efficiency: Require less capital than cash secured puts or covered calls
- Risk Management: Limit downside exposure through the long option
Why Vertical Spreads Are More Challenging
Many traders consider vertical spreads easy to manage. This is wrong. Vertical spreads present unique challenges that make them more difficult than single leg options:
- Bid-Ask Spreads: You pay the spread twice - once when opening and once when closing
- Early Assignment Risk: Short option can be assigned while long option cannot be exercised
- Complex Greeks: Delta, theta, and gamma interact differently between the two legs
- Execution Risk: Both legs must be filled simultaneously for proper spread pricing
Using the Options Screener
Tiblio's options screener updates every minute during market hours. The screener filters options based on your selected criteria and displays the best opportunities for each strategy.
The process works like this:
- Filter for options that match your strategy using a combination of column header filters and the Delta Range and DTE selectors
- Research stocks from the results list to find companies you want to trade
- Choose an option based on the your target return and risk of assignment
Symbols Included in the Screener
- All S&P 500 Constituents
- All Nasdaq 100 Constituents
- All Dow Jones Constituents
- 11 SPDR Sector ETFs
- SPY, DJI, QQQ, SPX, XSP, RUT
- Select stocks requested by customers
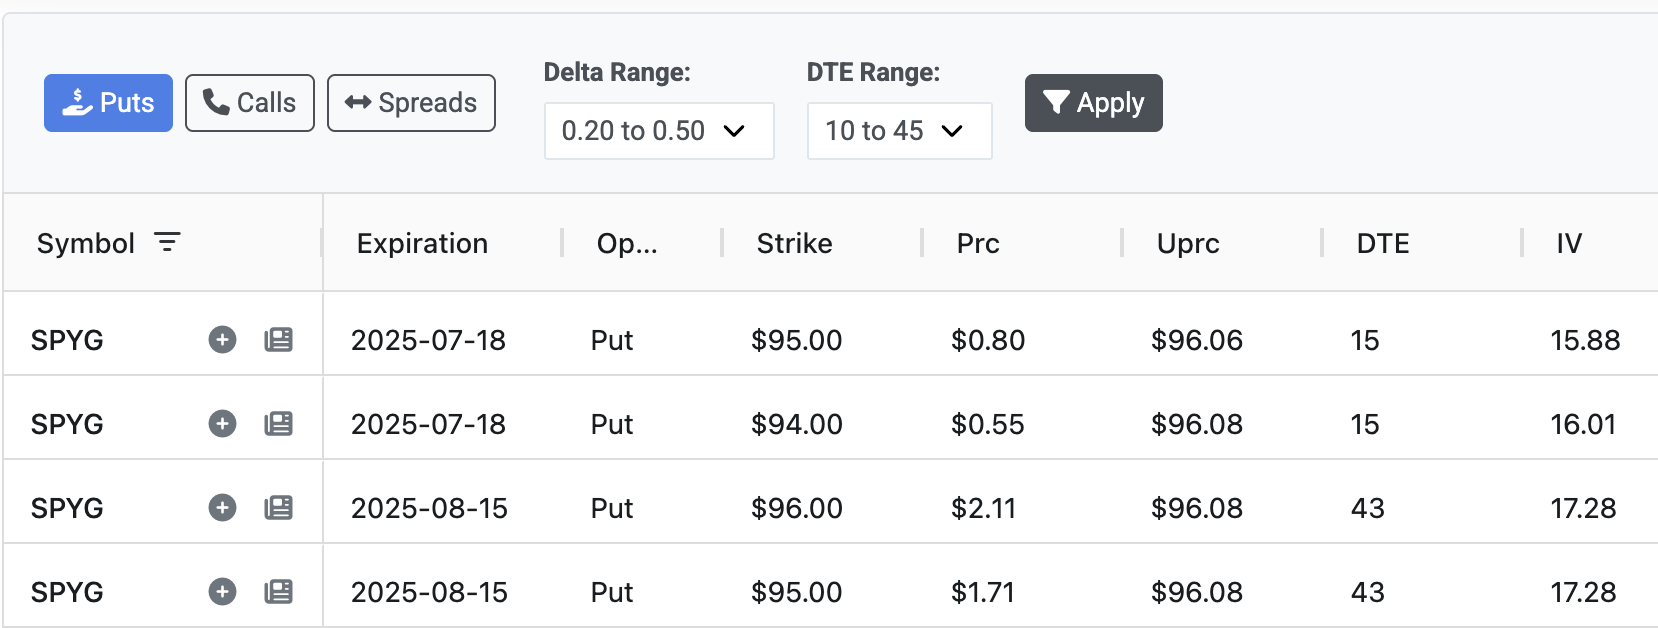
Cash Secured Puts and Covered Calls Screener Data
Here is a quick breakdown of the columns and their meanings:
Symbol
The stock ticker symbol for the underlying stock
Expiration
The date when the option expires
Strike
The strike price of the put option - the price at which you would buy the stock if assigned
Prc
The premium price you receive for selling the put option
DTE
Days to expiration - how many days until the option expires
IV
Implied volatility - the market's expectation of the stock's future volatility
Delta
The sensitivity of the option price to changes in the underlying stock price
Theta
Time decay - how much the option loses value each day
Max Ret
Maximum return in dollars if the option expires worthless
Max Ret Pct
Maximum return as a percentage of the strike price
Bid/Ask
The current bid and ask prices for the option
Earnings
Upcoming earnings date that could impact the stock price
Vertical Spreads Screener Columns
The vertical spreads screener displays these data columns:
Symbol
The stock ticker symbol for the underlying stock
Expiration
The date when both options expire
Put/Call
Whether the spread uses put options or call options
Strike1
The strike price of the short option (option you sell)
Strike2
The strike price of the long option (option you buy)
Prc
The net premium you receive for the spread
DTE
Days to expiration - how many days until both options expire
IV
Implied volatility of the short option
Delta
The delta of the short option
Max Ret
Maximum return in dollars if the spread expires with maximum value
Max Ret Day
Maximum return per day - useful for comparing trades with different time frames
Max Ret Pct
Maximum return as a percentage of the maximum loss
Max Loss
Maximum loss in dollars if the spread expires with maximum loss
Break Even
The stock price at which the spread breaks even at expiration
Earnings
Upcoming earnings date that could impact the stock price
Delta Range Strategy Guide
Delta ranges correspond to different risk levels and strategies:
- 0.05-0.20: Low probability of assignment, lower premiums, safer for beginners
- 0.20-0.35: Moderate probability of assignment, balanced risk and reward
- 0.35-0.50: Higher probability of assignment, higher premiums, more aggressive
- 0.20-0.50: Wide range covering moderate to aggressive strategies
Sample Trades from the Screener
Cash Secured Put Trades:
SELL -1 AAPL 18 JUL 25 175.0 PUT @2.15 LMTSELL -1 MSFT 25 JUL 25 380.0 PUT @3.40 LMTSELL -1 NVDA 01 AUG 25 900.0 PUT @12.50 LMTSELL -1 TSLA 11 JUL 25 230.0 PUT @5.80 LMTSELL -1 GOOGL 18 JUL 25 160.0 PUT @2.90 LMTCovered Call Trades:
SELL -1 AAPL 18 JUL 25 185.0 CALL @1.25 LMTSELL -1 MSFT 25 JUL 25 420.0 CALL @2.10 LMTSELL -1 NVDA 01 AUG 25 1050.0 CALL @8.30 LMTSELL -1 TSLA 11 JUL 25 270.0 CALL @3.90 LMTSELL -1 GOOGL 18 JUL 25 180.0 CALL @1.80 LMTVertical Spread Trades:
SELL -1 AAPL 18 JUL 25 175.0 PUT @2.15 LMT; BUY -1 AAPL 18 JUL 25 170.0 PUT @1.45 LMTSELL -1 MSFT 25 JUL 25 380.0 PUT @3.40 LMT; BUY -1 MSFT 25 JUL 25 375.0 PUT @2.80 LMTSELL -1 NVDA 01 AUG 25 900.0 PUT @12.50 LMT; BUY -1 NVDA 01 AUG 25 890.0 PUT @10.20 LMTSELL -1 TSLA 11 JUL 25 230.0 PUT @5.80 LMT; BUY -1 TSLA 11 JUL 25 225.0 PUT @4.60 LMTSELL -1 GOOGL 18 JUL 25 160.0 PUT @2.90 LMT; BUY -1 GOOGL 18 JUL 25 155.0 PUT @2.30 LMTThese trades can be copied directly into the Think or Swim platform for execution. Each trade represents an opportunity identified by Tiblio's screener algorithm.
The screener updates every minute during market hours to provide fresh opportunities based on current market conditions and volatility levels.