Key Metrics TTM
Key Metrics TTM
The Key Metrics TTM (Trailing Twelve Months) screener provides comprehensive financial metrics calculated over the past twelve months for all publicly traded companies. This screener is updated nightly and offers real-time insights into company performance, profitability, and financial health.
What is TTM Data?
Trailing Twelve Months (TTM) data represents the most recent 12-month period of a company's financial performance. Unlike quarterly or annual reports that may be outdated, TTM metrics provide a current view of how a company has performed over the most recent full year, making it ideal for comparative analysis and investment decisions.
Available Metrics
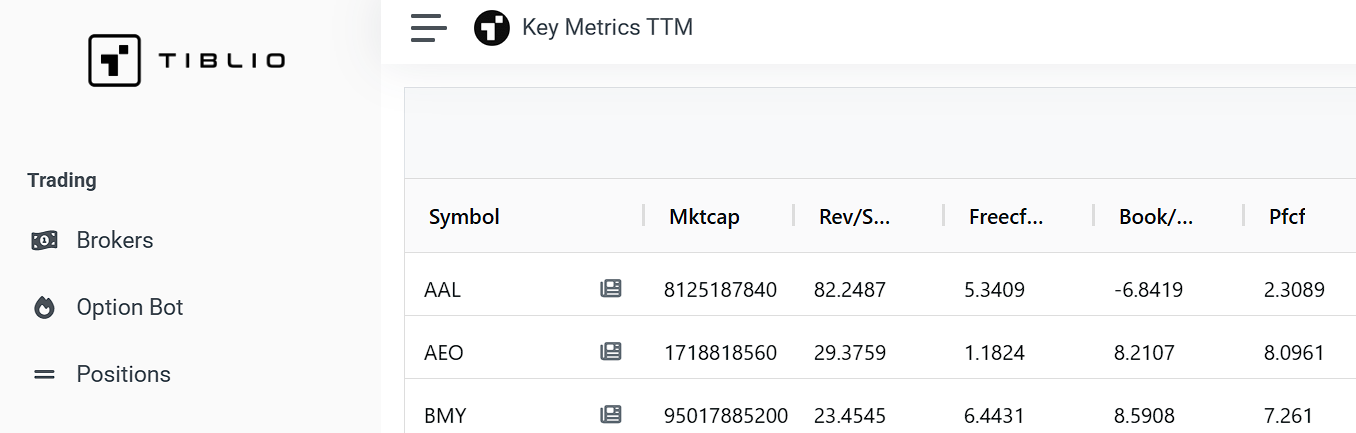
The Key Metrics TTM screener displays the following financial metrics:
Valuation Metrics
- Market Cap (MktCap) - Total market value of all outstanding shares
- Price-to-Earnings Ratio (PE) - Current stock price divided by earnings per share
- Price-to-Book Ratio (PB) - Market value compared to book value per share
- Price-to-Free Cash Flow (PFCF) - Market value relative to free cash flow generation
Per-Share Metrics
- Revenue per Share (Rev/Share) - Total revenue divided by outstanding shares
- Free Cash Flow per Share (FreeCF/Share) - Free cash flow divided by shares outstanding
- Book Value per Share (Book/Share) - Net asset value per outstanding share
Financial Health Indicators
- Current Ratio - Current assets divided by current liabilities, measuring short-term liquidity
- Debt-to-Equity (Debt/Equity) - Total debt relative to shareholder equity
- Debt-to-Assets (Debt/Assets) - Total debt as a percentage of total assets
Profitability Metrics
- Return on Equity (ROE) - Net income divided by shareholder equity
- Return on Invested Capital (ROIC) - Measures how efficiently capital is deployed
- Dividend Yield (DivYield) - Annual dividends per share divided by stock price
How to Use the Screener
The Key Metrics TTM screener allows you to:
- Sort and Filter - Click on any column header to sort data ascending or descending. Use the filter options to narrow down results based on specific criteria
- Compare Companies - Easily compare financial metrics across different companies and sectors
- Identify Investment Opportunities - Screen for companies with attractive valuation ratios, strong profitability, or solid financial health
- Export Data - Download the filtered results for further analysis
Investment Applications
Traders and investors use Key Metrics TTM data for:
- Value Investing - Identifying undervalued companies using PE, PB, and other valuation metrics
- Quality Assessment - Evaluating company quality through ROE, ROIC, and debt ratios
- Sector Comparison - Comparing companies within the same industry or sector
- Screening Workflows - Creating custom screens to find companies meeting specific financial criteria
- Portfolio Analysis - Analyzing the financial characteristics of potential or current holdings
Getting Started
To access the Key Metrics TTM screener, navigate to Research → Fundamentals → Key Metrics TTM in the main menu. The screener loads with all available companies and their current TTM metrics. Use the search functionality to find specific companies or apply filters to narrow your results.
This tool is part of Tiblio's comprehensive fundamental analysis suite, designed to help you make informed investment decisions based on solid financial data.