Financial Ratings
Financial Ratings Overview
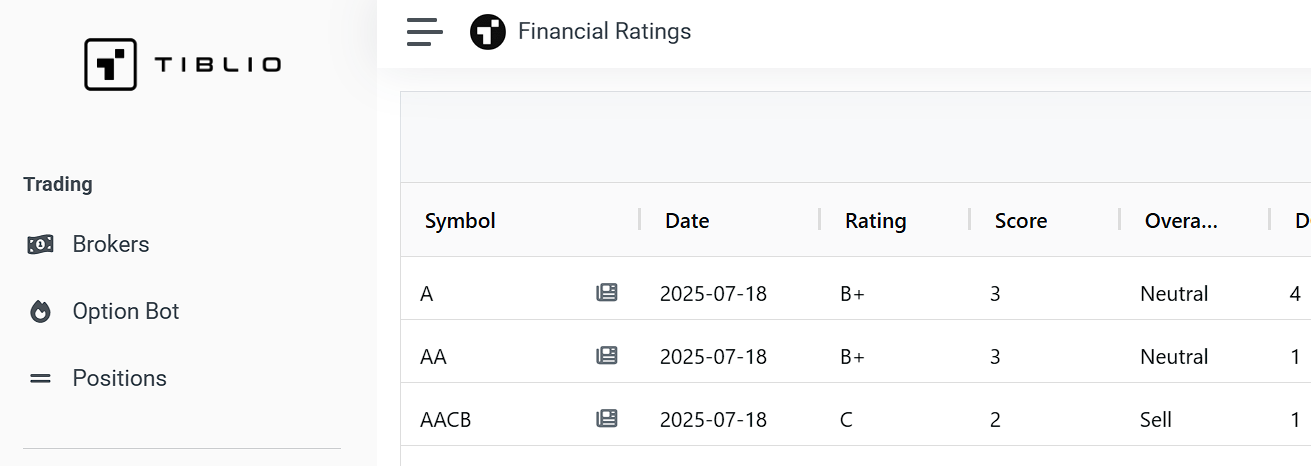
The Financial Ratings screener provides comprehensive rating assessments for stocks across global exchanges, delivering detailed evaluation based on multiple financial indicators. This powerful analytical tool combines discounted cash flow analysis, profitability metrics, and valuation ratios to generate objective ratings that help investors make informed buy, hold, or sell decisions.
Overall Rating System
Each company receives an overall letter grade rating from A+ (highest) to F (lowest) based on the comprehensive analysis of their financial statement strength, debt coverage ability, and ratio performance. These ratings provide a quick assessment of a company's financial health and investment attractiveness.
Rating Scale:
- A+ to A- - Excellent financial strength with strong fundamentals
- B+ to B- - Good financial position with solid performance
- C+ to C- - Average financial metrics with mixed signals
- D+ to D- - Below-average performance with potential concerns
- F - Poor financial condition requiring careful analysis
Component Rating Scores
Each overall rating is supported by individual component scores ranging from 1 (poor) to 5 (excellent) across six key financial areas. These granular scores allow investors to understand specific strengths and weaknesses within a company's financial profile.
Discounted Cash Flow (DCF) Score
The DCF score evaluates whether a company's current stock price represents good value based on its projected future cash flows. This intrinsic valuation method helps identify overvalued or undervalued securities by comparing the calculated fair value to the current market price.
Key Applications:
- Identify potentially undervalued growth opportunities
- Assess whether current market prices reflect fundamental value
- Compare valuation across companies and sectors
Return on Equity (ROE) Score
ROE measures how effectively a company generates profits from shareholders' equity, calculated as Net Income divided by Total Stockholder Equity. This metric reveals management's efficiency in using investor capital to create returns.
Interpretation Guidelines:
- Higher ROE generally indicates superior management performance
- Compare ROE within industry peer groups for context
- Consistent ROE trends matter more than single-period results
Return on Assets (ROA) Score
ROA evaluates how efficiently a company utilizes its total assets to generate profits, calculated as Net Income divided by Total Assets. This metric provides insight into operational efficiency regardless of financing structure.
Strategic Value:
- Assess management's ability to deploy assets productively
- Compare operational efficiency across different business models
- Identify companies maximizing returns from their asset base
Debt to Equity (D/E) Score
The D/E ratio measures financial leverage by comparing Long Term Debt to Total Stockholder Equity. This score evaluates a company's capital structure risk and its ability to meet debt obligations during economic downturns.
Risk Assessment:
- Lower D/E ratios generally indicate more conservative financial management
- Industry context matters - some sectors naturally carry higher debt levels
- Optimal leverage varies based on business stability and cash flow predictability
Price to Earnings (P/E) Score
The P/E score analyzes valuation by comparing stock price to earnings per share, calculated as Price divided by (Net Income / Share Number). This widely-used metric helps assess whether a stock is trading at a premium or discount relative to its earnings power.
Valuation Insights:
- Lower P/E ratios may indicate undervalued opportunities or company challenges
- Growth companies often command higher P/E multiples
- Sector and market comparisons provide essential context
Price to Book (P/B) Score
The P/B score evaluates whether a stock trades above or below its book value, calculated as Price divided by (Total Stockholder Equity / Share Number). This metric is particularly valuable for assessing asset-heavy businesses and identifying potential value investments.
Value Investing Applications:
- Identify stocks trading below tangible asset value
- Assess downside protection in distressed market conditions
- Screen for deep value opportunities in cyclical industries
Screening and Analysis Features
Interactive Data Grid:
The Financial Ratings screener utilizes the advanced AG Grid platform to provide professional-grade analytical capabilities. Users can sort by any rating component, apply multiple filters simultaneously, and customize their view to focus on specific financial criteria.
Key Capabilities:
- Multi-level sorting and filtering across all rating components
- Persistent state management saves your column arrangements and filters
- CSV export functionality for offline analysis and portfolio management
- Direct integration with company research pages and market news
- Real-time data updates ensure current rating information
Strategic Investment Applications
Quality Screening:
- Filter for companies with A and B ratings for quality-focused portfolios
- Identify high-ROE companies with strong profitability trends
- Screen for conservative debt levels in volatile market conditions
Value Discovery:
- Use DCF scores to identify fundamentally undervalued securities
- Combine low P/E and P/B scores for deep value screening
- Look for improving ratings trends indicating fundamental turnarounds
Risk Management:
- Avoid companies with consistently low D/E scores and high leverage
- Monitor existing holdings for deteriorating rating components
- Use overall ratings as position sizing guidelines
Options Strategy Support:
- Focus covered call writing on highly-rated, stable companies
- Use cash-secured puts on undervalued companies with strong ratings
- Avoid assignment risk on companies with deteriorating financial metrics
Best Practices for Financial Ratings Analysis
Holistic Evaluation
While overall ratings provide quick assessment, examine individual component scores to understand specific strengths and weaknesses. A company might have an average overall rating but excel in particular areas that align with your investment strategy.
Industry Context
Financial ratings should always be interpreted within industry context. Capital-intensive industries like utilities naturally have different debt profiles than technology companies. Compare ratings within sector peer groups for more meaningful analysis.
Trend Analysis
Monitor rating changes over time to identify improving or deteriorating financial conditions. A company with a current C rating but consistently improving component scores may represent a better opportunity than a B-rated company with declining metrics.
Complementary Analysis
Combine financial ratings with other fundamental analysis tools available in Tiblio's platform. Cross-reference ratings with Financial Scores (Altman Z-Score, Piotroski Score), Key Metrics TTM, and market news to build comprehensive investment cases.
The Financial Ratings screener transforms complex financial analysis into actionable investment insights, providing both broad market overview and granular company-specific detail. By combining comprehensive rating methodology with powerful screening capabilities, this tool helps investors build stronger portfolios based on objective financial merit rather than market sentiment alone.