



NGL Energy Partners Announces Earnings Call
TULSA, Okla.--(BUSINESS WIRE)--NGL Energy Partners Announces Earnings Call.
Business Wire10/14/2026Neutral
NGL Energy Partners LP is engaged in the crude oil and liquids logistics and water solutions businesses. The company is headquartered in Tulsa, Oklahoma.
| Revenue (TTM) | $3.52B |
| Gross Profit (TTM) | $1.04B |
| EBITDA | $667.51M |
| Operating Margin | 14.90% |
| Return on Equity | -37.70% |
| Return on Assets | 6.19% |
| Revenue/Share (TTM) | $28.13 |
| Book Value | $-4.42 |
| Price-to-Book | 60.83 |
| Price-to-Sales (TTM) | 0.52 |
| EV/Revenue | 1.526 |
| EV/EBITDA | 13.92 |
| Quarterly Earnings Growth (YoY) | 1129.00% |
| Quarterly Revenue Growth (YoY) | 59.10% |
| Shares Outstanding | $123.81M |
| Float | $111.35M |
| % Insiders | 11.91% |
| % Institutions | 60.51% |
Volatility is currently contracting
TULSA, Okla.--(BUSINESS WIRE)--NGL Energy Partners Announces Earnings Call.

Rising data center energy demand, stable fee-based revenues and pipeline projects are brightening the Zacks Oil and Gas - Pipeline MLP industry's outlook. EPD, ET and PAA are well poised to gain.

Western Midstream, Global Partners and NGL Energy Partners have been highlighted in this Industry Outlook article.
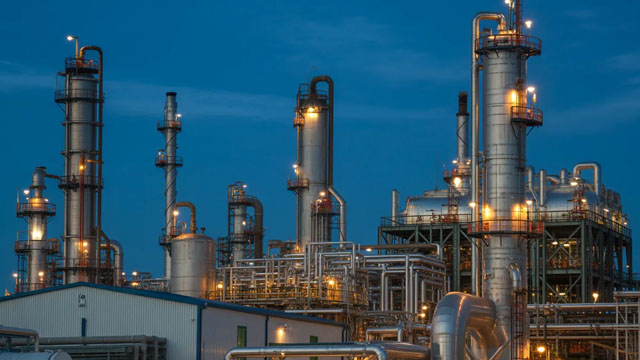
Following a careful analysis of the Zacks Oil and Gas - Refining & Marketing MLP industry, we advise keeping an eye on three stocks: WES, GLP and NGL.

U.S. natural gas liquids (NGL) exports are now projected to grow by more than 10% this year, driven largely by international buyers looking to replace disrupted Middle Eastern supplies. As the U.S.

TULSA, Okla.--(BUSINESS WIRE)--NGL Energy Partners LP Announces Quarterly Cash Distribution for the Class B, Class C, and Class D Preferred Units.
Investors need to pay close attention to NGL stock based on the movements in the options market lately.

Zacks spotlights Oportun Financial, Uranium Royalty and Amgen, alongside standout gains from its key stock portfolios.
Midstream MLPs and corporations generally posted strong second-quarter earnings, benefiting from record volume throughput, strong margins, and robust demand for natural gas and natural gas liquids (NGL) exports. Companies also demonstrated the defensive nature of their fee-based cash flows.
Does NGL Energy Partners LP (NGL) have what it takes to be a top stock pick for momentum investors? Let's find out.
Tiblio connects your broker and runs your put-and-call-writing strategy for you — on NGL and any ticker you trade — then tracks every position and per-strategy win rate.